At a glance

A summary

Lloyd’s has reported a pre-tax loss of £0.9bn, driven by £3.4bn net incurred COVID-19 losses adding 13.3% to the market’s combined ratio of 110.3%. 

Excluding COVID-19 claims, the market’s combined ratio has shown substantial improvement at 97.0% excluding COVID-19 losses – a 7.5% improvement when compared to 2018 (104.5%), demonstrating the positive impact of Lloyd’s sustained performance improvement measures.

Gross written premium(£m)
201629,862
201733,591
201835,527
201935,905
202035,466
Result before tax(£m)
20162,107
2017(2,001)
2018(1,001)
20192,532
2020(887)
Capital, reserves and subordinated loan notes(£m)
201628,597
201727,560
201828,222
201930,638
202033,941
Central assets(£m)
20162,879
20172,981
20183,211
20193,285
20203,308
Return on capital(%)
20168.1
2017(7.3)
2018(3.7)
20198.8
2020(2.8)
Combined ratio(%)
201697.9
2017114.0
2018104.5
2019102.1
2020110.3

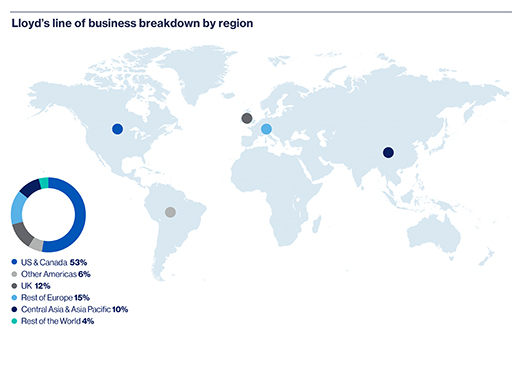
Lloyd’s line of business breakdown by region

US & Canada 53%

Other Americas 6%

UK 12%

Rest of Europe 15% 

Central Asia & Asia Pacific 10% 

Rest of world 4%

a graph showing the figures

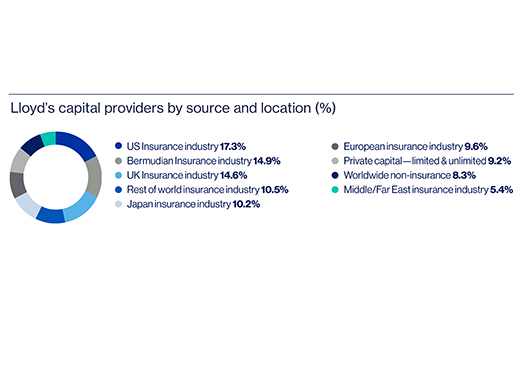
Lloyd’s capital providers by source and location

US insurance industry 17.3% 

Bermudian insurance industry 14.9%

UK insurance industry 14.6%

Rest of world insurance industry 10.5%

Japan insurance industry 10.2%

European insurance industry 9.6%

Private capital - limited and unlimited 9.2%

Worldwide non-insurance 8.3%

Middle/Far east insurance industry 5.4%