Lloyd’s Statistics is a collection of dashboards and data feeds available in the Insights Hub.
These provide a platform for both the analysis and extraction of key market and syndicate performance measures.
Data & Research
View all 'Data & Research'Lloyd’s Statistics is a collection of dashboards and data feeds available in the Insights Hub.
These provide a platform for both the analysis and extraction of key market and syndicate performance measures.
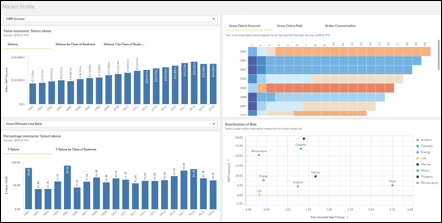
Lloyd's Statistics - Market Profile provides insights into premium income, risk adjusted rate change, acquisition costs, loss ratios, claims and broker concentration. All measures are available at Lloyd’s Global classes of business levels and year of account.
Information is sourced from various data returns, including the Performance Management Data return, Quarterly Monitoring Returns Part B (QMB), Technical Provisions Data and Xchanging Claims Services.
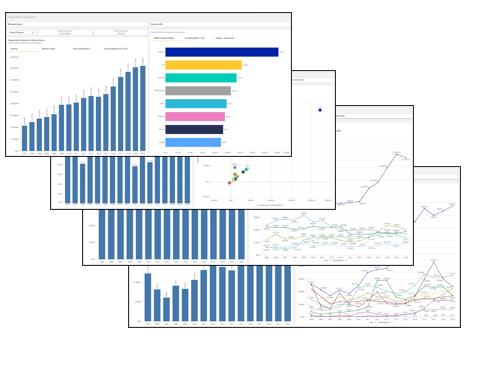
Lloyd's Statistics - Financial Performance contains summary financial statements for all active syndicates and an analysis of their historical performance. This tool allows you to visualise trends and efficiently identify areas of interest.
This product provides an overview of the business written by each syndicate, along with an analysis of their performance.
The historical performance of each syndicate has been analysed using a series of key performance ratios that measure each syndicate's performance against that of a notional market.
Fields available include: managing agent, syndicate, year, Lloyd’s Class of Business, Statement Type and Line Items.
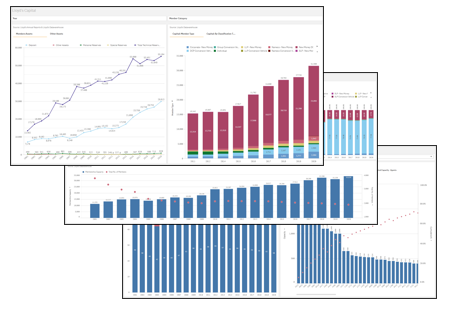
Lloyd's Statistics - Capital Explorer contains detailed statistics on Lloyd’s capital, capacity, membership of Lloyd's, Lloyd’s agents and syndicates.
This product provides insights into Lloyd’s capital, member, managing agents and syndicate capacity.
Data is sourced from Lloyd’s Datawarehouse and Annual Report.

Visit the Insights Hub to explore the analysis or sign up for access.